
How We Pipe Data

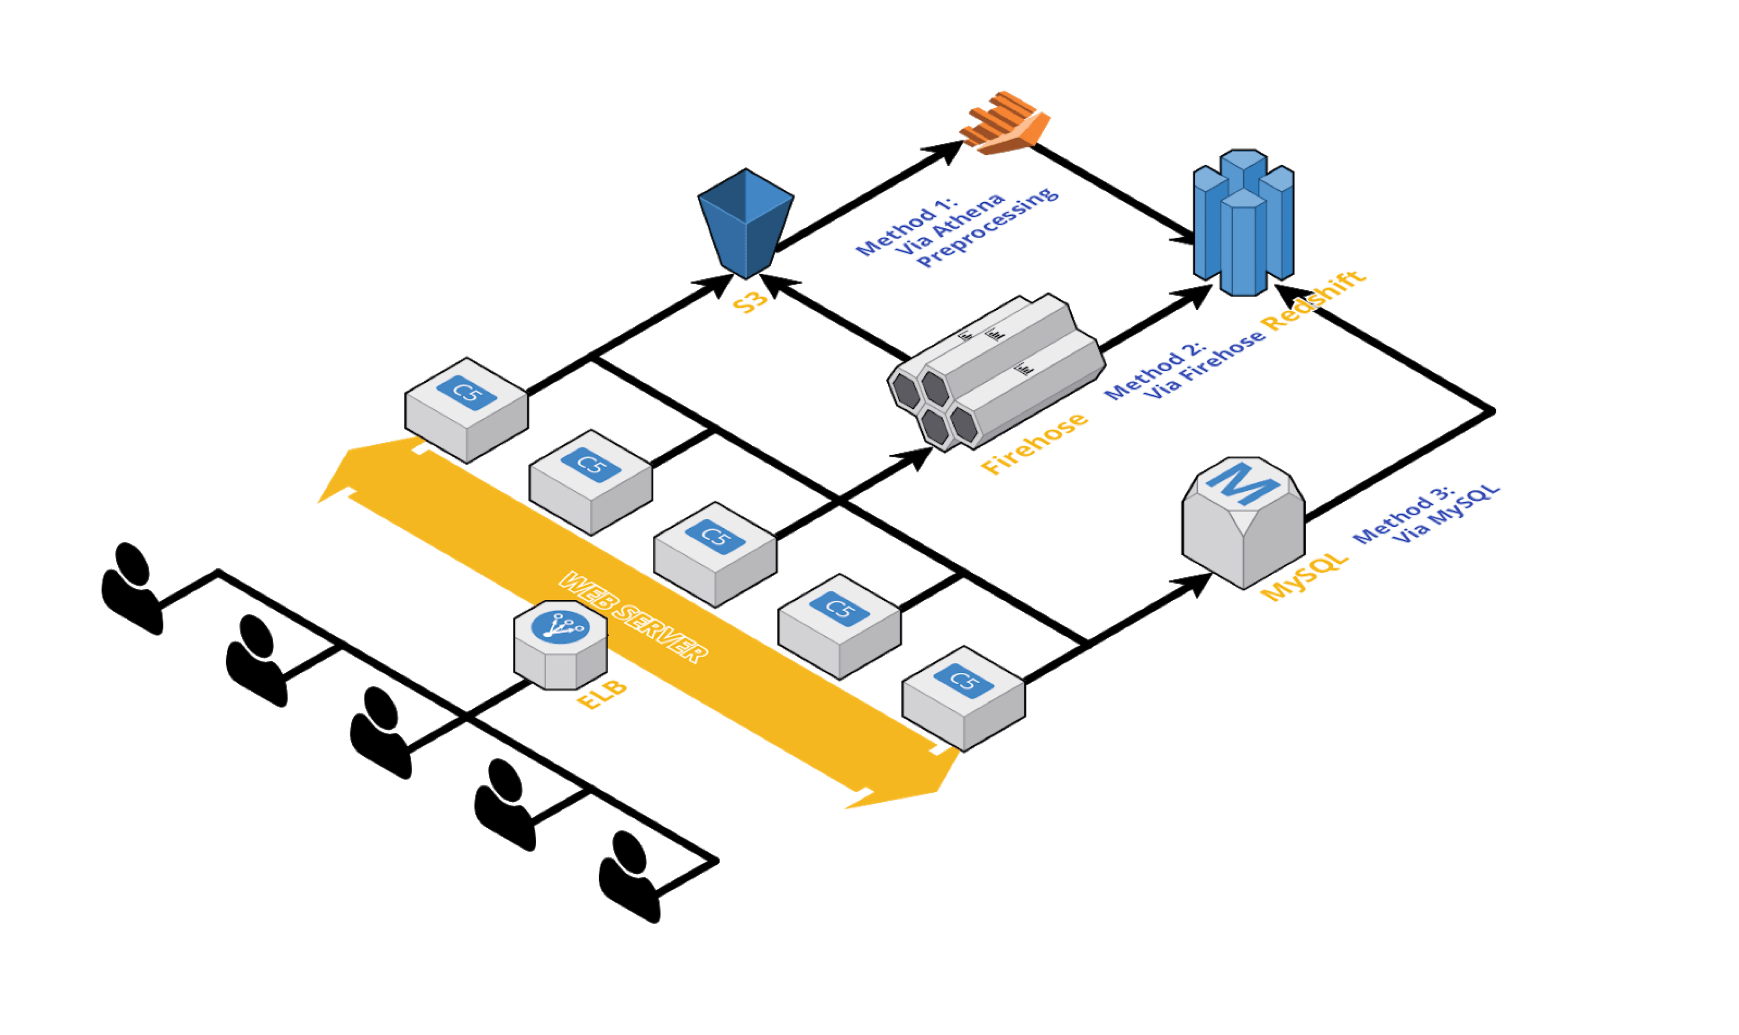
At Buzzvil, we are keeping track ofactivities of more than 17 million user in more than 30 nations. Such activities include various screen-related activities, AD impressions, AD clicks, AD conversions and beyond. These data comes from multitude of sources and usually get stored in different types of databases ( MySQL, DynamoDB, Redis, and even S3). By having these data in a single storage, we were able to analyze cross-service and cross-platform metrics with ease. Building and maintaining a data pipeline that directs the data from multiple sources to a single data warehouse was a challenge for our team. And here is how we did it! Before we discuss the pipeline, Redshift, our main data warehouse is worth mentioning in this blog post. It has surprised us since the beginning and is continuing to do so. Redshift is an AWS-managed, SQL based columnar data warehouse suited for complex and large-scale analytics. It is a solution well adapted by many enterprises customers (Yelp, Coursera, Pinterest, etc.), to drive insight from various types of data generated from their customers. At Buzzvil, we adapted Redshift because of the following reasons: Performance Performance Performance. Columnar storage -> Only access columns that you need. Complex queries involving multiple joins and aggregations are easily computable Distributed Storage Fast Data Ingestion (Ingest first, index and clean later) Horizontal Scalability No need for extra complexity that comes from sharding or clustering Since data are innately stored in nodes, horizontal scaling only involves adding additional nodes.